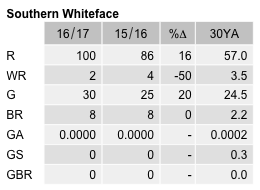
Southern Whiteface
Aphelocephala leucopsis
ABR description
The following is extracted from the Annual Bird Report for the twelve months to June 2017.
Uncommon, breeding resident
A ground-feeder in drier scrub and grassland margins.
General: Although the number of records and number of grids (32) are up this year, the number of birds seen (270) was almost the same as last year. Recorded in 42 weeks spread throughout the year, with slightly more (31%) in spring and slightly less (16%) in winter. Max 11 (well down on the 10 & 30YA of 50) sighted on 4 Jul at Naas and Apollo Rds (W S1), mean 3.2, median 2. Reporting rate 0.7% is the same as last year, but well below 10 YA and 30YA (both 2%). Abundance has remained at the low level of 0.2 over the last 5 years. 10 breeding records (10 & 30 YAs are 3 and 2 records) at 6 sites, including 5 records from Narrabundah Hill: earliest nb/17 Aug Mulanggari Grasslands GrL11 (GrB1) and latest dy/22 Jan LBath S Morass (LeM1); other breeding sites include JWNR, Centennial Trail Taylor GrK10, and Red Hill.
Abundance
Abundance is the average number of birds of that species per survey. Where the species was observed (presence recorded) but the number of birds seen was not recorded, this is treated as a count of zero.
Abundance by year
This chart shows the abundance of Southern Whiteface between 1982 and 2017. 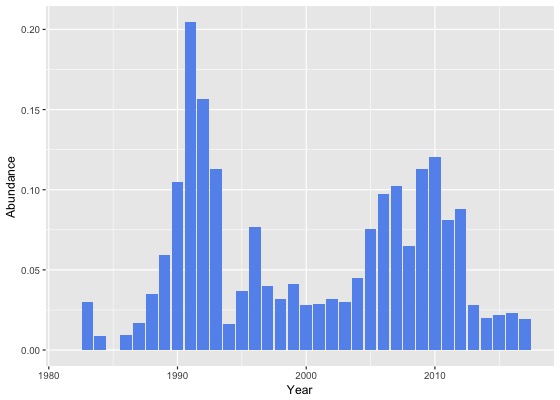
Abundance by month
This chart shows the monthly abundance of Southern Whiteface. The blue lines show the abundance for the twelve months to June 2017 and the bars show the average abundance for the period 1982 to 2017. 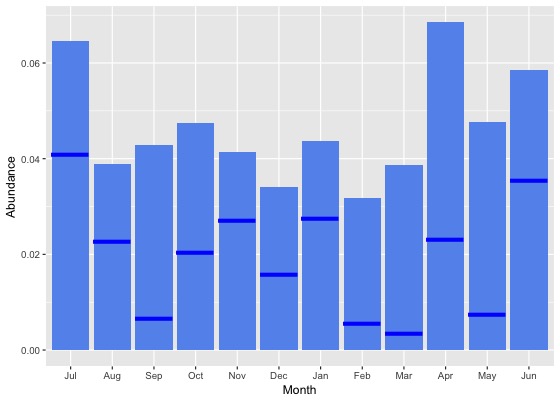
Abundance by season
This chart shows the seasonal abundance of Southern Whiteface. The blue lines show the seasonal abundance for the twelve months to June 2017 and the bars show the average seasonal abundance for the period 1982 to 2017. 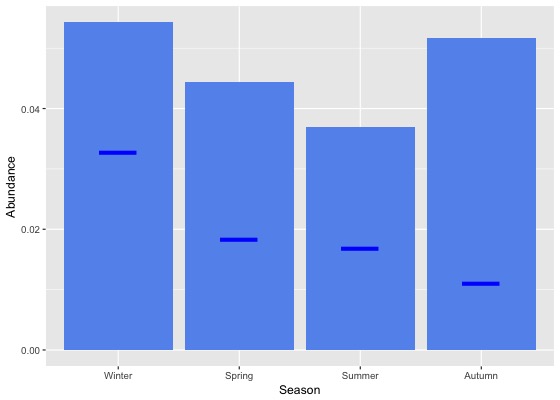
Abundance data
| Month | Season | ||||||||||||||||||
|---|---|---|---|---|---|---|---|---|---|---|---|---|---|---|---|---|---|---|---|
| Period | Jul | Aug | Sep | Oct | Nov | Dec | Jan | Feb | Mar | Apr | May | Jun | Winter | Spring | Summer | Autumn | All | ||
| All years | |||||||||||||||||||
| All | 0.1 | 0.0 | 0.0 | 0.0 | 0.0 | 0.0 | 0.0 | 0.0 | 0.0 | 0.1 | 0.0 | 0.1 | 0.1 | 0.0 | 0.0 | 0.1 | 0.0 | ||
| Previous years | |||||||||||||||||||
| All previous years | 0.1 | 0.0 | 0.0 | 0.1 | 0.0 | 0.0 | 0.0 | 0.0 | 0.0 | 0.1 | 0.1 | 0.1 | 0.1 | 0.0 | 0.0 | 0.1 | 0.1 | ||
| Previous 30 years | 0.1 | 0.0 | 0.0 | 0.1 | 0.0 | 0.0 | 0.0 | 0.0 | 0.0 | 0.1 | 0.1 | 0.1 | 0.1 | 0.0 | 0.0 | 0.1 | 0.1 | ||
| Previous 20 years | 0.1 | 0.0 | 0.0 | 0.0 | 0.0 | 0.0 | 0.0 | 0.0 | 0.0 | 0.1 | 0.0 | 0.1 | 0.1 | 0.0 | 0.0 | 0.1 | 0.0 | ||
| 10 year groups | |||||||||||||||||||
| [2007,2017) | 0.1 | 0.1 | 0.1 | 0.1 | 0.0 | 0.0 | 0.0 | 0.0 | 0.0 | 0.1 | 0.0 | 0.1 | 0.1 | 0.1 | 0.0 | 0.1 | 0.0 | ||
| [1997,2007) | 0.0 | 0.0 | 0.0 | 0.0 | 0.0 | 0.0 | 0.1 | 0.0 | 0.0 | 0.1 | 0.0 | 0.1 | 0.0 | 0.0 | 0.0 | 0.1 | 0.0 | ||
| [1987,1997) | 0.1 | 0.0 | 0.1 | 0.1 | 0.0 | 0.0 | 0.1 | 0.1 | 0.1 | 0.1 | 0.1 | 0.1 | 0.1 | 0.1 | 0.1 | 0.1 | 0.1 | ||
| 5 year groups | |||||||||||||||||||
| [2012,2017) | 0.0 | 0.0 | 0.1 | 0.0 | 0.0 | 0.0 | 0.0 | 0.0 | 0.0 | 0.0 | 0.0 | 0.0 | 0.0 | 0.0 | 0.0 | 0.0 | 0.0 | ||
| [2007,2012) | 0.1 | 0.1 | 0.1 | 0.1 | 0.1 | 0.1 | 0.1 | 0.1 | 0.1 | 0.1 | 0.1 | 0.1 | 0.1 | 0.1 | 0.1 | 0.1 | 0.1 | ||
| [2002,2007) | 0.1 | 0.0 | 0.0 | 0.1 | 0.0 | 0.0 | 0.0 | 0.0 | 0.1 | 0.1 | 0.0 | 0.1 | 0.1 | 0.0 | 0.0 | 0.1 | 0.1 | ||
| [1997,2002) | 0.0 | 0.0 | 0.0 | 0.0 | 0.0 | 0.0 | 0.1 | 0.0 | 0.0 | 0.0 | 0.0 | 0.0 | 0.0 | 0.0 | 0.0 | 0.0 | 0.0 | ||
| [1992,1997) | 0.2 | 0.0 | 0.1 | 0.1 | 0.0 | 0.0 | 0.1 | 0.1 | 0.1 | 0.0 | 0.1 | 0.0 | 0.1 | 0.1 | 0.1 | 0.1 | 0.1 | ||
| [1987,1992) | 0.1 | 0.0 | 0.0 | 0.1 | 0.0 | 0.0 | 0.0 | 0.1 | 0.1 | 0.1 | 0.1 | 0.1 | 0.1 | 0.0 | 0.0 | 0.1 | 0.1 | ||
| Year | |||||||||||||||||||
| 2017 | 0.0 | 0.0 | 0.0 | 0.0 | 0.0 | 0.0 | 0.0 | 0.0 | 0.0 | 0.0 | 0.0 | 0.0 | 0.0 | 0.0 | 0.0 | 0.0 | 0.0 | ||
| 2016 | 0.0 | 0.1 | 0.0 | 0.0 | 0.0 | 0.0 | 0.0 | 0.0 | 0.0 | 0.0 | 0.0 | 0.0 | 0.0 | 0.0 | 0.0 | 0.0 | 0.0 | ||
| 2015 | 0.0 | 0.0 | 0.0 | 0.0 | 0.0 | 0.0 | 0.0 | 0.0 | 0.0 | 0.0 | 0.0 | 0.0 | 0.0 | 0.0 | 0.0 | 0.0 | 0.0 | ||
| 2014 | 0.0 | 0.0 | 0.0 | 0.0 | 0.0 | 0.0 | 0.0 | 0.0 | 0.1 | 0.0 | 0.0 | 0.0 | 0.0 | 0.0 | 0.0 | 0.0 | 0.0 | ||
| 2013 | 0.0 | 0.0 | 0.0 | 0.0 | 0.0 | 0.0 | 0.0 | 0.0 | 0.0 | 0.0 | 0.1 | 0.0 | 0.0 | 0.0 | 0.0 | 0.0 | 0.0 | ||
| 2012 | 0.1 | 0.1 | 0.2 | 0.1 | 0.1 | 0.1 | 0.0 | 0.0 | 0.0 | 0.2 | 0.0 | 0.1 | 0.1 | 0.1 | 0.0 | 0.1 | 0.1 | ||
| 2011 | 0.1 | 0.2 | 0.1 | 0.2 | 0.2 | 0.0 | 0.1 | 0.0 | 0.0 | 0.1 | 0.1 | 0.0 | 0.1 | 0.1 | 0.0 | 0.1 | 0.1 | ||
| 2010 | 0.1 | 0.1 | 0.0 | 0.1 | 0.1 | 0.1 | 0.2 | 0.2 | 0.1 | 0.2 | 0.1 | 0.2 | 0.2 | 0.1 | 0.2 | 0.1 | 0.1 | ||
| 2009 | 0.2 | 0.1 | 0.1 | 0.1 | 0.1 | 0.1 | 0.0 | 0.2 | 0.3 | 0.2 | 0.1 | 0.1 | 0.1 | 0.1 | 0.1 | 0.2 | 0.1 | ||
| 2008 | 0.2 | 0.0 | 0.0 | 0.0 | 0.1 | 0.1 | 0.1 | 0.1 | 0.1 | 0.1 | 0.2 | 0.1 | 0.1 | 0.0 | 0.1 | 0.1 | 0.1 | ||
| 2007 | 0.2 | 0.0 | 0.1 | 0.1 | 0.2 | 0.1 | 0.0 | 0.2 | 0.1 | 0.2 | 0.2 | 0.1 | 0.1 | 0.1 | 0.1 | 0.1 | 0.1 | ||
| 2006 | 0.1 | 0.0 | 0.1 | 0.1 | 0.0 | 0.1 | 0.1 | 0.1 | 0.1 | 0.3 | 0.0 | 0.2 | 0.1 | 0.1 | 0.1 | 0.1 | 0.1 | ||
| 2005 | 0.1 | 0.1 | 0.0 | 0.0 | 0.0 | 0.0 | 0.0 | 0.0 | 0.0 | 0.2 | 0.1 | 0.1 | 0.1 | 0.0 | 0.0 | 0.1 | 0.1 | ||
| 2004 | 0.0 | 0.0 | 0.1 | 0.1 | 0.0 | 0.0 | 0.0 | 0.0 | 0.1 | 0.1 | 0.1 | 0.0 | 0.0 | 0.1 | 0.0 | 0.1 | 0.0 | ||
| 2003 | 0.1 | 0.0 | 0.0 | 0.0 | 0.1 | 0.0 | 0.1 | 0.0 | 0.0 | 0.0 | 0.0 | 0.0 | 0.0 | 0.0 | 0.0 | 0.0 | 0.0 | ||
| 2002 | 0.1 | 0.1 | 0.0 | 0.1 | 0.0 | 0.0 | 0.0 | 0.0 | 0.0 | 0.0 | 0.0 | 0.0 | 0.0 | 0.0 | 0.0 | 0.0 | 0.0 | ||
| 2001 | 0.0 | 0.0 | 0.0 | 0.0 | 0.0 | 0.0 | 0.1 | 0.0 | 0.0 | 0.0 | 0.1 | 0.0 | 0.0 | 0.0 | 0.0 | 0.0 | 0.0 | ||
| 2000 | 0.0 | 0.0 | 0.0 | 0.0 | 0.1 | 0.0 | 0.0 | 0.0 | 0.1 | 0.1 | 0.0 | 0.0 | 0.0 | 0.0 | 0.0 | 0.1 | 0.0 | ||
| 1999 | 0.0 | 0.0 | 0.1 | 0.0 | 0.1 | 0.1 | 0.0 | 0.1 | 0.1 | 0.1 | 0.0 | 0.0 | 0.0 | 0.1 | 0.0 | 0.0 | 0.0 | ||
| 1998 | 0.0 | 0.0 | 0.1 | 0.0 | 0.0 | 0.0 | 0.2 | 0.0 | 0.0 | 0.1 | 0.0 | 0.0 | 0.0 | 0.0 | 0.1 | 0.0 | 0.0 | ||
| 1997 | 0.0 | 0.1 | 0.0 | 0.1 | 0.0 | 0.0 | 0.4 | 0.1 | 0.1 | 0.0 | 0.0 | 0.0 | 0.0 | 0.0 | 0.1 | 0.0 | 0.0 | ||
| 1996 | 0.1 | 0.0 | 0.0 | 0.0 | 0.0 | 0.0 | 0.3 | 0.1 | 0.0 | 0.1 | 0.3 | 0.0 | 0.0 | 0.0 | 0.1 | 0.1 | 0.1 | ||
| 1995 | 0.0 | 0.0 | 0.0 | 0.1 | 0.0 | 0.0 | 0.1 | 0.0 | 0.0 | 0.0 | 0.2 | 0.0 | 0.0 | 0.0 | 0.0 | 0.1 | 0.0 | ||
| 1994 | 0.0 | 0.0 | 0.0 | 0.0 | 0.0 | 0.0 | 0.0 | 0.0 | 0.0 | 0.0 | 0.0 | 0.0 | 0.0 | 0.0 | 0.0 | 0.0 | 0.0 | ||
| 1993 | 0.0 | 0.1 | 0.3 | 0.3 | 0.2 | 0.2 | 0.0 | 0.0 | 0.1 | 0.1 | 0.0 | 0.1 | 0.1 | 0.3 | 0.1 | 0.0 | 0.1 | ||
| 1992 | 0.7 | 0.2 | 0.1 | 0.1 | 0.0 | 0.1 | 0.2 | 0.1 | 0.3 | 0.1 | 0.1 | 0.1 | 0.3 | 0.1 | 0.1 | 0.1 | 0.2 | ||
| 1991 | 0.1 | 0.1 | 0.1 | 0.2 | 0.1 | 0.1 | 0.0 | 0.1 | 0.2 | 0.3 | 0.5 | 0.9 | 0.3 | 0.2 | 0.1 | 0.3 | 0.2 | ||
| 1990 | 0.1 | 0.0 | 0.0 | 0.1 | 0.0 | 0.1 | 0.2 | 0.2 | 0.1 | 0.4 | 0.3 | 0.1 | 0.1 | 0.0 | 0.1 | 0.2 | 0.1 | ||
| 1989 | 0.1 | 0.0 | 0.1 | 0.1 | 0.1 | 0.1 | 0.1 | 0.0 | 0.1 | 0.1 | 0.1 | 0.1 | 0.1 | 0.1 | 0.1 | 0.1 | 0.1 | ||
| 1988 | 0.0 | 0.0 | 0.0 | 0.0 | 0.0 | 0.0 | 0.0 | 0.1 | 0.0 | 0.0 | 0.0 | 0.0 | 0.0 | 0.0 | 0.0 | 0.0 | 0.0 | ||
| 1987 | 0.0 | 0.0 | 0.0 | 0.0 | 0.0 | 0.0 | 0.0 | 0.0 | 0.0 | 0.0 | 0.0 | 0.0 | 0.0 | 0.0 | 0.0 | 0.0 | 0.0 | ||
| 1986 | 0.0 | 0.0 | 0.0 | 0.0 | 0.0 | 0.0 | 0.0 | 0.0 | 0.0 | 0.0 | 0.0 | 0.0 | 0.0 | 0.0 | 0.0 | 0.0 | 0.0 | ||
| 1985 | 0.0 | 0.0 | 0.0 | 0.0 | 0.0 | 0.0 | 0.0 | 0.0 | 0.0 | 0.0 | 0.0 | 0.0 | 0.0 | 0.0 | 0.0 | 0.0 | 0.0 | ||
| 1984 | 0.0 | 0.0 | 0.0 | 0.0 | 0.0 | 0.0 | 0.0 | 0.0 | 0.0 | 0.1 | 0.0 | 0.0 | 0.0 | 0.0 | 0.0 | 0.0 | 0.0 | ||
| 1983 | 0.0 | 0.0 | 0.0 | 0.2 | 0.0 | 0.0 | 0.0 | 0.0 | 0.0 | - | 0.0 | 0.0 | 0.0 | 0.1 | 0.0 | 0.0 | 0.0 | ||
| 1982 | - | 0.0 | - | 0.0 | 0.0 | 0.0 | - | 0.0 | - | 0.0 | - | 0.0 | 0.0 | 0.0 | 0.0 | 0.0 | 0.0 | ||
Reporting rates
Reporting rate is the proportion of all surveys in which the species was present.
Reporting rate by year
This chart shows the reporting rate of Southern Whiteface each year between 1982 and 2017. 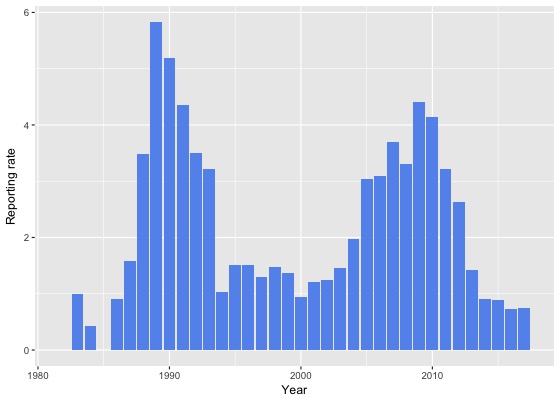
Reporting rate by month
This chart shows the reporting rate by month of Southern Whiteface. The blue lines show the reporting rate for the twelve months to June 2017 and the bars show the average reporting rate for the period 1982 to 2017. 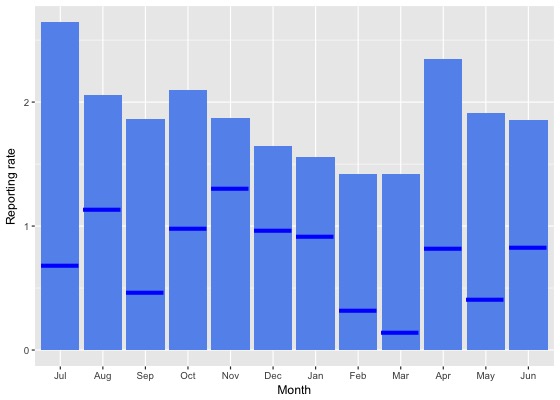
Reporting rate by season
This chart shows the seasonal reporting rate of Southern Whiteface. The blue lines show the seasonal reporting rate for the twelve months to June 2017 and the bars show the average seasonal reporting rate for the period 1982 to 2017. 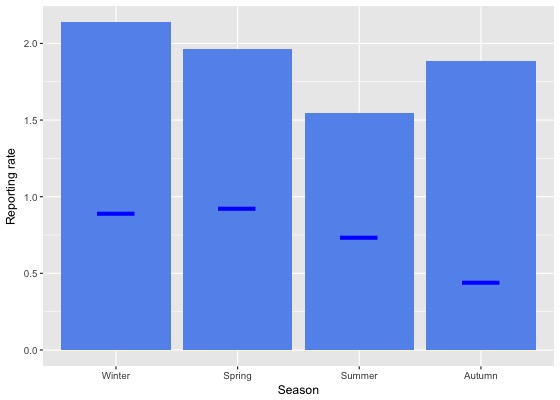
Reporting rate data
| Month | Season | ||||||||||||||||||
|---|---|---|---|---|---|---|---|---|---|---|---|---|---|---|---|---|---|---|---|
| Period | Jul | Aug | Sep | Oct | Nov | Dec | Jan | Feb | Mar | Apr | May | Jun | Winter | Spring | Summer | Autumn | All | ||
| All years | |||||||||||||||||||
| All | 2.6 | 2.1 | 1.9 | 2.1 | 1.9 | 1.6 | 1.6 | 1.4 | 1.4 | 2.4 | 1.9 | 1.9 | 2.1 | 2.0 | 1.5 | 1.9 | 1.9 | ||
| Previous years | |||||||||||||||||||
| All previous years | 2.9 | 2.2 | 2.1 | 2.2 | 2.0 | 1.7 | 1.7 | 1.7 | 1.6 | 2.6 | 2.3 | 2.1 | 2.4 | 2.1 | 1.7 | 2.1 | 2.1 | ||
| Previous 30 years | 3.0 | 2.3 | 2.1 | 2.3 | 2.0 | 1.8 | 1.7 | 1.7 | 1.7 | 2.6 | 2.3 | 2.1 | 2.4 | 2.1 | 1.7 | 2.2 | 2.1 | ||
| Previous 20 years | 2.5 | 2.0 | 1.8 | 2.1 | 1.7 | 1.6 | 1.5 | 1.3 | 1.4 | 2.5 | 2.0 | 1.8 | 2.1 | 1.9 | 1.5 | 2.0 | 1.8 | ||
| 10 year groups | |||||||||||||||||||
| [2007,2017) | 3.0 | 2.4 | 1.8 | 2.1 | 1.6 | 1.8 | 1.3 | 1.4 | 1.1 | 2.4 | 2.3 | 2.0 | 2.4 | 1.9 | 1.5 | 1.9 | 1.9 | ||
| [1997,2007) | 1.8 | 1.3 | 1.9 | 2.0 | 1.9 | 1.1 | 2.0 | 1.2 | 1.9 | 2.8 | 1.2 | 1.5 | 1.5 | 2.0 | 1.4 | 2.1 | 1.8 | ||
| [1987,1997) | 4.6 | 3.0 | 3.2 | 3.5 | 3.0 | 2.8 | 2.9 | 3.4 | 3.1 | 3.1 | 3.4 | 3.4 | 3.6 | 3.2 | 3.0 | 3.2 | 3.3 | ||
| 5 year groups | |||||||||||||||||||
| [2012,2017) | 1.7 | 1.8 | 1.5 | 1.6 | 1.0 | 1.2 | 0.8 | 0.6 | 0.5 | 1.1 | 1.1 | 1.1 | 1.5 | 1.4 | 0.8 | 0.9 | 1.1 | ||
| [2007,2012) | 6.6 | 4.3 | 2.5 | 2.8 | 3.4 | 3.3 | 3.3 | 4.8 | 2.8 | 5.6 | 5.7 | 3.6 | 4.5 | 2.8 | 3.6 | 4.6 | 3.7 | ||
| [2002,2007) | 2.5 | 1.6 | 2.3 | 2.3 | 2.4 | 1.6 | 1.9 | 1.5 | 2.4 | 3.7 | 1.2 | 2.0 | 2.1 | 2.3 | 1.7 | 2.6 | 2.2 | ||
| [1997,2002) | 0.6 | 0.9 | 1.5 | 1.6 | 1.3 | 0.4 | 2.1 | 0.9 | 1.3 | 1.7 | 1.1 | 0.7 | 0.7 | 1.5 | 1.1 | 1.4 | 1.2 | ||
| [1992,1997) | 1.8 | 1.9 | 3.3 | 2.6 | 1.8 | 1.8 | 1.3 | 1.8 | 2.5 | 1.4 | 1.9 | 1.8 | 1.8 | 2.5 | 1.6 | 1.9 | 2.0 | ||
| [1987,1992) | 5.8 | 3.7 | 3.1 | 4.0 | 3.5 | 3.2 | 3.8 | 4.0 | 3.5 | 4.0 | 4.2 | 4.3 | 4.5 | 3.6 | 3.6 | 3.9 | 3.9 | ||
| Year | |||||||||||||||||||
| 2017 | 0.7 | 1.1 | 0.5 | 1.0 | 1.3 | 1.0 | 0.9 | 0.3 | 0.1 | 0.8 | 0.4 | 0.8 | 0.9 | 0.9 | 0.7 | 0.4 | 0.7 | ||
| 2016 | 0.6 | 2.1 | 1.2 | 0.8 | 0.4 | 0.5 | 0.7 | 0.4 | 0.3 | 0.8 | 0.7 | 0.7 | 1.2 | 0.8 | 0.5 | 0.6 | 0.7 | ||
| 2015 | 1.2 | 1.1 | 0.8 | 0.8 | 0.5 | 1.4 | 0.6 | 0.3 | 0.5 | 1.3 | 0.9 | 1.6 | 1.4 | 0.7 | 0.7 | 0.9 | 0.9 | ||
| 2014 | 1.2 | 1.3 | 1.3 | 0.6 | 0.7 | 1.4 | 0.9 | 0.7 | 0.8 | 0.8 | 1.1 | 0.8 | 1.0 | 0.9 | 0.9 | 0.9 | 0.9 | ||
| 2013 | 1.8 | 0.9 | 2.2 | 2.7 | 1.5 | 1.0 | 1.1 | 1.2 | 0.4 | 0.7 | 2.5 | 1.1 | 1.3 | 2.2 | 1.1 | 0.9 | 1.4 | ||
| 2012 | 5.5 | 3.5 | 3.2 | 4.1 | 2.7 | 2.4 | 0.9 | 1.5 | 1.2 | 2.2 | 2.1 | 1.5 | 3.3 | 3.5 | 1.5 | 1.8 | 2.6 | ||
| 2011 | 4.1 | 7.2 | 3.5 | 4.4 | 4.2 | 1.5 | 3.0 | 1.4 | 1.2 | 4.4 | 3.6 | 2.6 | 3.9 | 4.1 | 2.0 | 3.1 | 3.2 | ||
| 2010 | 7.3 | 5.3 | 2.6 | 2.1 | 4.3 | 2.9 | 6.3 | 8.2 | 2.8 | 8.1 | 3.9 | 3.8 | 4.9 | 2.7 | 4.9 | 5.1 | 4.1 | ||
| 2009 | 7.2 | 5.2 | 3.0 | 3.3 | 1.8 | 6.3 | 2.7 | 6.7 | 5.1 | 7.8 | 4.6 | 3.2 | 4.8 | 2.9 | 5.2 | 6.1 | 4.4 | ||
| 2008 | 9.7 | 1.7 | 1.5 | 1.7 | 2.7 | 4.1 | 3.2 | 5.6 | 2.7 | 2.5 | 9.0 | 3.7 | 5.1 | 1.8 | 4.2 | 3.7 | 3.3 | ||
| 2007 | 3.3 | 1.9 | 1.7 | 2.5 | 4.1 | 3.0 | 1.6 | 6.1 | 3.0 | 6.8 | 9.8 | 4.9 | 4.0 | 2.5 | 3.0 | 5.9 | 3.7 | ||
| 2006 | 5.3 | 2.9 | 3.5 | 2.3 | 1.8 | 3.9 | 3.4 | 2.2 | 3.2 | 6.5 | 0.0 | 2.3 | 3.3 | 2.5 | 3.3 | 3.5 | 3.1 | ||
| 2005 | 3.7 | 2.8 | 2.6 | 2.2 | 3.4 | 2.0 | 2.8 | 1.1 | 2.6 | 8.2 | 1.5 | 3.4 | 3.4 | 2.7 | 2.1 | 3.9 | 3.0 | ||
| 2004 | 0.8 | 2.0 | 3.4 | 2.9 | 3.5 | 1.4 | 0.6 | 1.0 | 1.6 | 2.7 | 2.9 | 1.2 | 1.2 | 3.3 | 1.0 | 2.3 | 2.0 | ||
| 2003 | 1.7 | 0.0 | 1.7 | 2.6 | 2.8 | 0.4 | 3.0 | 1.1 | 1.8 | 0.9 | 0.0 | 1.2 | 1.0 | 2.3 | 1.3 | 1.1 | 1.5 | ||
| 2002 | 2.3 | 0.8 | 0.0 | 1.7 | 1.0 | 1.2 | 0.0 | 2.0 | 2.3 | 0.6 | 2.4 | 1.1 | 1.5 | 0.9 | 1.1 | 1.7 | 1.3 | ||
| 2001 | 1.3 | 0.6 | 1.2 | 0.8 | 0.6 | 0.7 | 2.0 | 1.0 | 0.6 | 2.0 | 3.5 | 1.0 | 1.0 | 0.9 | 1.2 | 1.7 | 1.2 | ||
| 2000 | 0.0 | 0.7 | 0.9 | 0.9 | 1.9 | 0.3 | 1.2 | 0.0 | 2.0 | 1.8 | 0.0 | 0.5 | 0.4 | 1.2 | 0.5 | 1.5 | 0.9 | ||
| 1999 | 0.0 | 0.0 | 1.7 | 3.1 | 1.9 | 0.6 | 0.7 | 1.4 | 2.2 | 2.1 | 0.0 | 0.9 | 0.6 | 2.3 | 0.9 | 1.4 | 1.4 | ||
| 1998 | 0.0 | 0.0 | 3.3 | 2.2 | 0.9 | 0.0 | 5.9 | 1.9 | 0.0 | 2.6 | 0.0 | 0.0 | 0.0 | 2.1 | 2.2 | 0.6 | 1.5 | ||
| 1997 | 0.0 | 5.2 | 0.9 | 2.6 | 0.9 | 0.0 | 5.9 | 1.8 | 2.5 | 0.0 | 0.0 | 0.0 | 1.4 | 1.3 | 1.9 | 0.5 | 1.3 | ||
| 1996 | 1.5 | 2.1 | 1.3 | 2.6 | 0.9 | 1.0 | 1.0 | 1.2 | 1.0 | 1.6 | 3.4 | 1.1 | 1.6 | 1.7 | 1.0 | 1.8 | 1.5 | ||
| 1995 | 2.2 | 1.6 | 0.0 | 2.4 | 0.9 | 0.0 | 1.8 | 1.6 | 2.0 | 1.6 | 3.9 | 0.0 | 1.3 | 1.3 | 1.1 | 2.3 | 1.5 | ||
| 1994 | 0.0 | 0.0 | 4.4 | 0.0 | 2.2 | 0.0 | 0.0 | 1.7 | 1.1 | 0.8 | 0.0 | 1.1 | 0.5 | 2.1 | 0.6 | 0.7 | 1.0 | ||
| 1993 | 0.0 | 2.6 | 8.1 | 5.3 | 4.5 | 4.3 | 2.0 | 3.1 | 2.5 | 1.7 | 0.0 | 4.3 | 2.6 | 5.9 | 3.1 | 1.4 | 3.2 | ||
| 1992 | 4.6 | 3.7 | 4.7 | 3.2 | 1.4 | 4.8 | 1.7 | 2.4 | 7.0 | 1.7 | 2.6 | 3.3 | 3.9 | 3.2 | 3.1 | 3.9 | 3.5 | ||
| 1991 | 4.7 | 2.1 | 3.5 | 4.9 | 5.2 | 2.7 | 0.0 | 2.0 | 4.8 | 6.8 | 6.6 | 10.0 | 4.8 | 4.5 | 1.7 | 6.0 | 4.3 | ||
| 1990 | 8.4 | 4.9 | 3.2 | 6.1 | 3.7 | 5.6 | 8.3 | 2.8 | 2.3 | 6.0 | 6.8 | 2.6 | 5.8 | 4.4 | 5.6 | 4.9 | 5.2 | ||
| 1989 | 8.7 | 4.3 | 4.8 | 5.8 | 5.6 | 6.5 | 5.9 | 4.6 | 5.6 | 6.2 | 5.9 | 6.5 | 6.4 | 5.4 | 5.7 | 5.9 | 5.8 | ||
| 1988 | 2.6 | 3.0 | 3.4 | 2.7 | 3.5 | 1.0 | 2.5 | 5.7 | 4.5 | 4.8 | 4.0 | 4.8 | 3.4 | 3.2 | 3.0 | 4.4 | 3.5 | ||
| 1987 | 0.0 | 0.0 | 1.2 | 2.3 | 1.8 | 0.9 | 2.6 | 2.9 | 1.0 | 0.4 | 1.7 | 1.0 | 0.9 | 1.8 | 2.2 | 1.0 | 1.6 | ||
| 1986 | 0.0 | 0.0 | 3.8 | 0.0 | 0.0 | 2.9 | 0.0 | 0.0 | 0.0 | 0.0 | 3.4 | 0.0 | 0.0 | 1.5 | 1.1 | 0.9 | 0.9 | ||
| 1985 | 0.0 | 0.0 | 0.0 | 0.0 | 0.0 | 0.0 | 0.0 | 0.0 | 0.0 | 0.0 | 0.0 | 0.0 | 0.0 | 0.0 | 0.0 | 0.0 | 0.0 | ||
| 1984 | 0.0 | 0.0 | 0.0 | 0.0 | 0.0 | 0.0 | 0.0 | 0.0 | 0.0 | 2.9 | 0.0 | 0.0 | 0.0 | 0.0 | 0.0 | 1.1 | 0.4 | ||
| 1983 | 0.0 | 0.0 | 0.0 | 7.7 | 0.0 | 0.0 | 0.0 | 0.0 | 0.0 | - | 0.0 | 0.0 | 0.0 | 3.7 | 0.0 | 0.0 | 1.0 | ||
| 1982 | - | 0.0 | - | 0.0 | 0.0 | 0.0 | - | 0.0 | - | 0.0 | - | 0.0 | 0.0 | 0.0 | 0.0 | 0.0 | 0.0 | ||
Breeding data
Breeding records by month
Number of breeding records by breeding code and month, 2017 and all years| Breeding code | Jul | Aug | Sep | Oct | Nov | Dec | Jan | Feb | Mar | Apr | May | Jun |
|---|---|---|---|---|---|---|---|---|---|---|---|---|
| 2017 | ||||||||||||
| Breeding (BLA code) | 0 | 0 | 0 | 0 | 0 | 0 | 0 | 0 | 0 | 0 | 0 | 0 |
| Carrying Food | 0 | 0 | 0 | 0 | 0 | 0 | 0 | 0 | 0 | 0 | 0 | 0 |
| Copulating | 0 | 0 | 0 | 0 | 0 | 0 | 0 | 0 | 0 | 0 | 0 | 0 |
| Display | 0 | 0 | 0 | 0 | 0 | 0 | 0 | 0 | 0 | 0 | 0 | 0 |
| Dependent young | 0 | 0 | 0 | 1 | 0 | 0 | 1 | 0 | 0 | 0 | 0 | 0 |
| Faecal sac | 0 | 0 | 0 | 0 | 0 | 0 | 0 | 0 | 0 | 0 | 0 | 0 |
| Inspecting hollow | 0 | 0 | 0 | 0 | 0 | 0 | 0 | 0 | 0 | 0 | 0 | 0 |
| Nest building | 0 | 2 | 0 | 1 | 0 | 0 | 0 | 0 | 0 | 0 | 0 | 0 |
| Nest with eggs | 0 | 0 | 0 | 0 | 0 | 0 | 0 | 0 | 0 | 0 | 0 | 0 |
| Nest with young | 0 | 0 | 0 | 0 | 0 | 0 | 0 | 0 | 0 | 0 | 0 | 0 |
| On/leaving nest | 0 | 1 | 0 | 1 | 3 | 0 | 0 | 0 | 0 | 0 | 0 | 0 |
| All years | ||||||||||||
| Breeding (BLA code) | 1 | 2 | 1 | 0 | 0 | 0 | 0 | 0 | 0 | 0 | 0 | 0 |
| Carrying Food | 0 | 2 | 3 | 5 | 3 | 1 | 0 | 0 | 0 | 0 | 0 | 0 |
| Copulating | 0 | 0 | 0 | 0 | 0 | 0 | 0 | 0 | 0 | 0 | 0 | 0 |
| Display | 0 | 1 | 0 | 0 | 0 | 0 | 0 | 0 | 0 | 0 | 0 | 0 |
| Dependent young | 0 | 0 | 0 | 5 | 3 | 6 | 6 | 0 | 0 | 0 | 0 | 0 |
| Faecal sac | 0 | 0 | 0 | 0 | 2 | 0 | 0 | 0 | 0 | 0 | 0 | 0 |
| Inspecting hollow | 0 | 1 | 1 | 1 | 0 | 0 | 0 | 0 | 0 | 0 | 0 | 0 |
| Nest building | 3 | 4 | 7 | 4 | 1 | 0 | 0 | 0 | 0 | 1 | 0 | 0 |
| Nest with eggs | 0 | 0 | 0 | 0 | 0 | 0 | 0 | 0 | 0 | 0 | 0 | 0 |
| Nest with young | 0 | 0 | 2 | 2 | 1 | 0 | 0 | 0 | 0 | 0 | 0 | 0 |
| On/leaving nest | 0 | 2 | 0 | 3 | 3 | 0 | 0 | 0 | 0 | 0 | 0 | 0 |
Breeding records by year
Average number of breeding records per period by breeding code| Period | Breeding (BLA code) | Carrying Food | Copulating | Display | Dependent young | Faecal sac | Inspecting hollow | Nest building | Nest with eggs | Nest with young | On/leaving nest |
|---|---|---|---|---|---|---|---|---|---|---|---|
| All years | |||||||||||
| All | 0.1 | 0.4 | 0.0 | 0.0 | 0.6 | 0.1 | 0.1 | 0.6 | 0.0 | 0.1 | 0.2 |
| Previous years | |||||||||||
| All previous years | 0.1 | 0.4 | 0.0 | 0.0 | 0.5 | 0.1 | 0.1 | 0.5 | 0.0 | 0.1 | 0.1 |
| Previous 30 years | 0.1 | 0.5 | 0.0 | 0.0 | 0.6 | 0.1 | 0.1 | 0.6 | 0.0 | 0.2 | 0.1 |
| Previous 20 years | 0.2 | 0.5 | 0.0 | 0.0 | 0.6 | 0.0 | 0.1 | 0.6 | 0.0 | 0.1 | 0.1 |
| 10 year groups | |||||||||||
| [2007,2017) | 0.3 | 0.6 | 0.0 | 0.1 | 0.9 | 0.0 | 0.1 | 0.5 | 0.0 | 0.1 | 0.2 |
| [1997,2007) | 0.1 | 0.4 | 0.0 | 0.0 | 0.3 | 0.0 | 0.2 | 0.6 | 0.0 | 0.1 | 0.1 |
| [1987,1997) | 0.0 | 0.4 | 0.0 | 0.0 | 0.6 | 0.2 | 0.0 | 0.6 | 0.0 | 0.3 | 0.0 |
| 5 year groups | |||||||||||
| [2012,2017) | 0.0 | 0.4 | 0.0 | 0.2 | 0.8 | 0.0 | 0.2 | 0.8 | 0.0 | 0.2 | 0.2 |
| [2007,2012) | 0.6 | 0.8 | 0.0 | 0.0 | 1.0 | 0.0 | 0.0 | 0.2 | 0.0 | 0.0 | 0.2 |
| [2002,2007) | 0.2 | 0.8 | 0.0 | 0.0 | 0.6 | 0.0 | 0.2 | 0.6 | 0.0 | 0.2 | 0.2 |
| [1997,2002) | 0.0 | 0.0 | 0.0 | 0.0 | 0.0 | 0.0 | 0.2 | 0.6 | 0.0 | 0.0 | 0.0 |
| [1992,1997) | 0.0 | 0.2 | 0.0 | 0.0 | 0.0 | 0.4 | 0.0 | 0.4 | 0.0 | 0.4 | 0.0 |
| [1987,1992) | 0.0 | 0.6 | 0.0 | 0.0 | 1.2 | 0.0 | 0.0 | 0.8 | 0.0 | 0.2 | 0.0 |
| Year | |||||||||||
| 2017 | 0.0 | 0.0 | 0.0 | 0.0 | 2.0 | 0.0 | 0.0 | 3.0 | 0.0 | 0.0 | 5.0 |
| 2016 | 0.0 | 1.0 | 0.0 | 1.0 | 2.0 | 0.0 | 0.0 | 3.0 | 0.0 | 0.0 | 1.0 |
| 2015 | 0.0 | 1.0 | 0.0 | 0.0 | 0.0 | 0.0 | 0.0 | 0.0 | 0.0 | 0.0 | 0.0 |
| 2014 | 0.0 | 0.0 | 0.0 | 0.0 | 1.0 | 0.0 | 0.0 | 1.0 | 0.0 | 1.0 | 0.0 |
| 2013 | 0.0 | 0.0 | 0.0 | 0.0 | 0.0 | 0.0 | 0.0 | 0.0 | 0.0 | 0.0 | 0.0 |
| 2012 | 0.0 | 0.0 | 0.0 | 0.0 | 1.0 | 0.0 | 1.0 | 0.0 | 0.0 | 0.0 | 0.0 |
| 2011 | 0.0 | 2.0 | 0.0 | 0.0 | 0.0 | 0.0 | 0.0 | 0.0 | 0.0 | 0.0 | 0.0 |
| 2010 | 1.0 | 1.0 | 0.0 | 0.0 | 3.0 | 0.0 | 0.0 | 0.0 | 0.0 | 0.0 | 0.0 |
| 2009 | 1.0 | 0.0 | 0.0 | 0.0 | 1.0 | 0.0 | 0.0 | 1.0 | 0.0 | 0.0 | 1.0 |
| 2008 | 1.0 | 1.0 | 0.0 | 0.0 | 0.0 | 0.0 | 0.0 | 0.0 | 0.0 | 0.0 | 0.0 |
| 2007 | 0.0 | 0.0 | 0.0 | 0.0 | 1.0 | 0.0 | 0.0 | 0.0 | 0.0 | 0.0 | 0.0 |
| 2006 | 0.0 | 0.0 | 0.0 | 0.0 | 1.0 | 0.0 | 0.0 | 0.0 | 0.0 | 0.0 | 0.0 |
| 2005 | 0.0 | 4.0 | 0.0 | 0.0 | 0.0 | 0.0 | 1.0 | 2.0 | 0.0 | 0.0 | 1.0 |
| 2004 | 1.0 | 0.0 | 0.0 | 0.0 | 1.0 | 0.0 | 0.0 | 0.0 | 0.0 | 1.0 | 0.0 |
| 2003 | 0.0 | 0.0 | 0.0 | 0.0 | 1.0 | 0.0 | 0.0 | 1.0 | 0.0 | 0.0 | 0.0 |
| 2002 | 0.0 | 0.0 | 0.0 | 0.0 | 0.0 | 0.0 | 0.0 | 0.0 | 0.0 | 0.0 | 0.0 |
| 2001 | 0.0 | 0.0 | 0.0 | 0.0 | 0.0 | 0.0 | 0.0 | 1.0 | 0.0 | 0.0 | 0.0 |
| 2000 | 0.0 | 0.0 | 0.0 | 0.0 | 0.0 | 0.0 | 0.0 | 0.0 | 0.0 | 0.0 | 0.0 |
| 1999 | 0.0 | 0.0 | 0.0 | 0.0 | 0.0 | 0.0 | 0.0 | 0.0 | 0.0 | 0.0 | 0.0 |
| 1998 | 0.0 | 0.0 | 0.0 | 0.0 | 0.0 | 0.0 | 0.0 | 2.0 | 0.0 | 0.0 | 0.0 |
| 1997 | 0.0 | 0.0 | 0.0 | 0.0 | 0.0 | 0.0 | 1.0 | 0.0 | 0.0 | 0.0 | 0.0 |
| 1996 | 0.0 | 0.0 | 0.0 | 0.0 | 0.0 | 0.0 | 0.0 | 0.0 | 0.0 | 0.0 | 0.0 |
| 1995 | 0.0 | 0.0 | 0.0 | 0.0 | 0.0 | 0.0 | 0.0 | 1.0 | 0.0 | 0.0 | 0.0 |
| 1994 | 0.0 | 0.0 | 0.0 | 0.0 | 0.0 | 0.0 | 0.0 | 0.0 | 0.0 | 0.0 | 0.0 |
| 1993 | 0.0 | 1.0 | 0.0 | 0.0 | 0.0 | 2.0 | 0.0 | 1.0 | 0.0 | 2.0 | 0.0 |
| 1992 | 0.0 | 0.0 | 0.0 | 0.0 | 0.0 | 0.0 | 0.0 | 0.0 | 0.0 | 0.0 | 0.0 |
| 1991 | 0.0 | 0.0 | 0.0 | 0.0 | 2.0 | 0.0 | 0.0 | 0.0 | 0.0 | 0.0 | 0.0 |
| 1990 | 0.0 | 1.0 | 0.0 | 0.0 | 1.0 | 0.0 | 0.0 | 1.0 | 0.0 | 0.0 | 0.0 |
| 1989 | 0.0 | 2.0 | 0.0 | 0.0 | 1.0 | 0.0 | 0.0 | 2.0 | 0.0 | 0.0 | 0.0 |
| 1988 | 0.0 | 0.0 | 0.0 | 0.0 | 1.0 | 0.0 | 0.0 | 0.0 | 0.0 | 0.0 | 0.0 |
| 1987 | 0.0 | 0.0 | 0.0 | 0.0 | 1.0 | 0.0 | 0.0 | 1.0 | 0.0 | 1.0 | 0.0 |
| 1986 | 0.0 | 0.0 | 0.0 | 0.0 | 0.0 | 0.0 | 0.0 | 0.0 | 0.0 | 0.0 | 0.0 |
| 1985 | 0.0 | 0.0 | 0.0 | 0.0 | 0.0 | 0.0 | 0.0 | 0.0 | 0.0 | 0.0 | 0.0 |
| 1984 | 0.0 | 0.0 | 0.0 | 0.0 | 0.0 | 0.0 | 0.0 | 0.0 | 0.0 | 0.0 | 0.0 |
| 1983 | 0.0 | 0.0 | 0.0 | 0.0 | 0.0 | 0.0 | 0.0 | 0.0 | 0.0 | 0.0 | 0.0 |
| 1982 | 0.0 | 0.0 | 0.0 | 0.0 | 0.0 | 0.0 | 0.0 | 0.0 | 0.0 | 0.0 | 0.0 |
Distribution map
Distribution - 2017
This map shows the observed distribution of the Southern Whiteface for 2017.
The red circles are the grid cells where Southern Whiteface have been reported.
The transparency of the red circles indicate how many surveys sheets were submitted for that grid cell; the darker the red the more reliable the data. Of the 315 grid cells with reports, 83 had only one sheet; an example is grid number T17.
The size of the circle represents the reporting rate. The maximum reporting rate for Southern Whiteface was 100.0% (eg grid number T17) and the minimum was 0.1% (eg grid number L14). 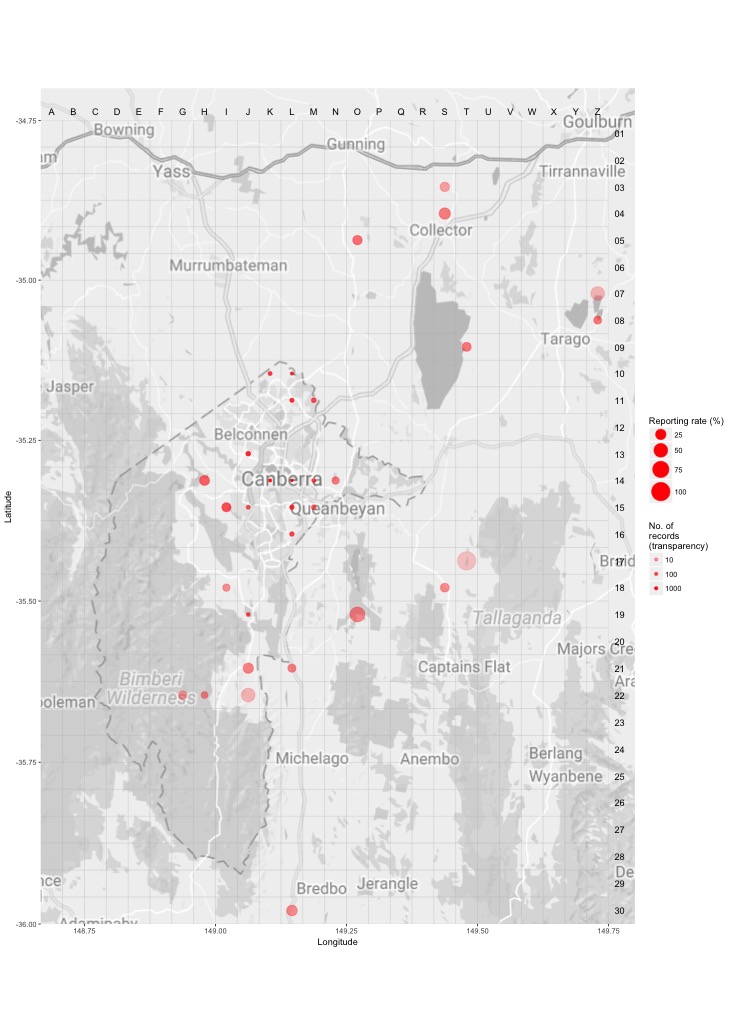
Distribution - all years
This map shows the observed distribution of the Southern Whiteface for all years.
The red circles are the grid cells where Southern Whiteface have been reported.
The transparency of the red circles indicate how many surveys sheets were submitted for that grid cell; the darker the red the more reliable the data. Of the 703 grid cells with reports, 55 had only one sheet; an example is grid number B13.
The size of the circle represents the reporting rate. The maximum reporting rate for Southern Whiteface was 100.0% (eg grid number B13) and the minimum was 0.0% (eg grid number K13). 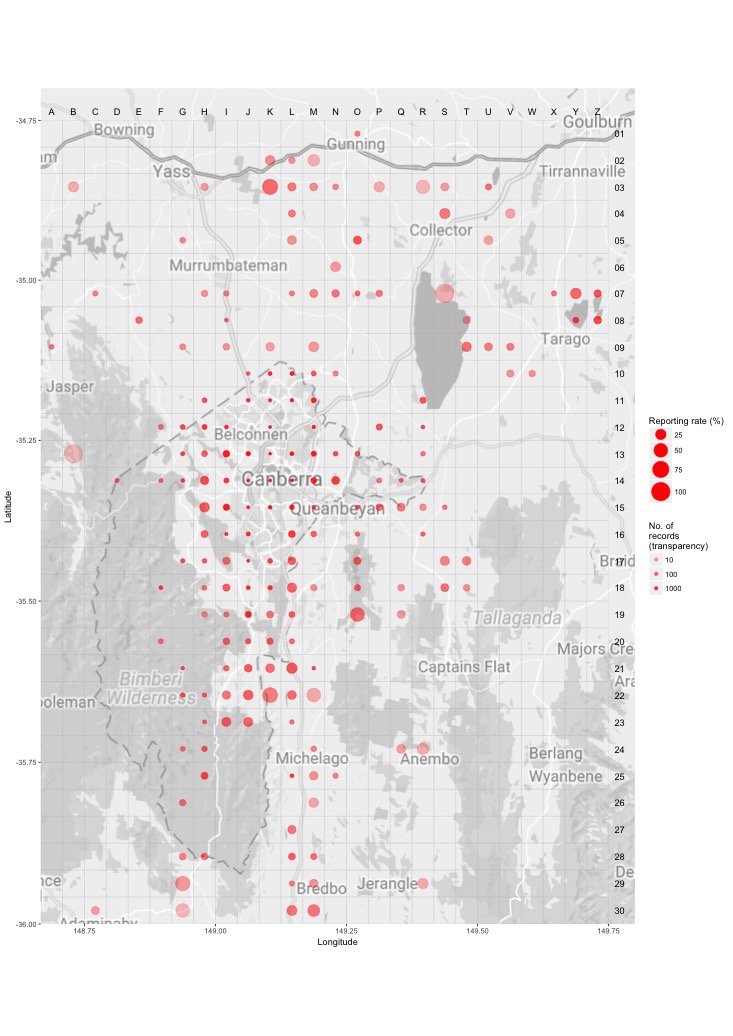
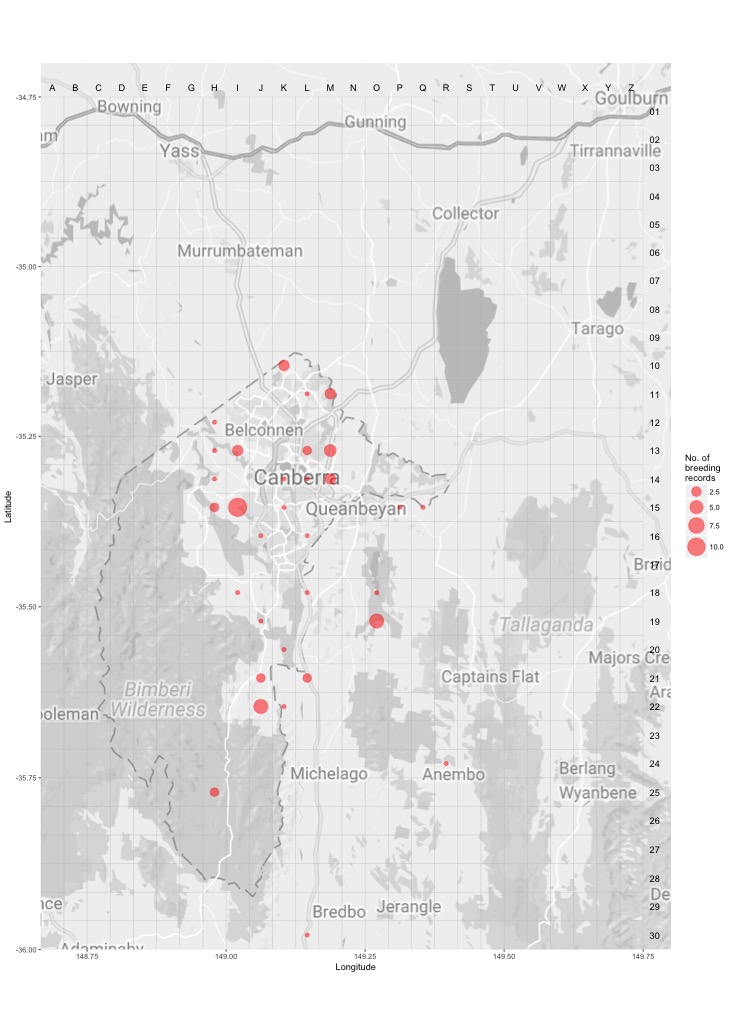
Breeding map
Breeding - 2017
This map shows the breeding distribution of the Southern Whiteface for 2017.
The red circles are the grid cells where breeding activity for Southern Whiteface have been reported.
The size of the circle represents the number of reports. 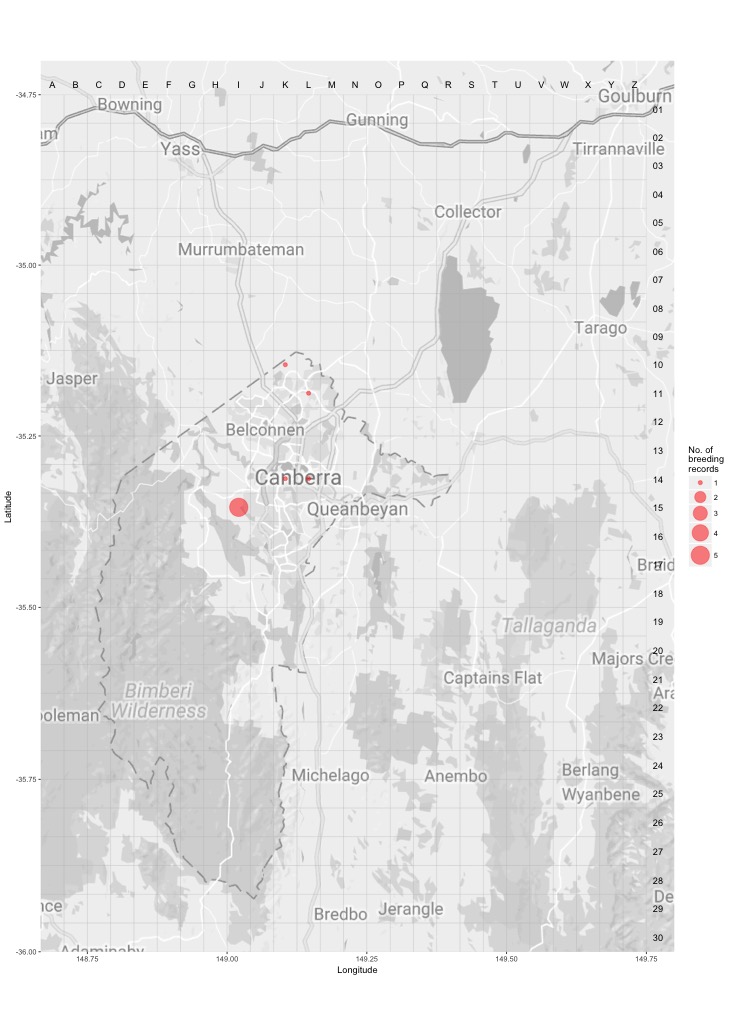
Breeding - all years
This map shows the breeding distribution of the Southern Whiteface for all years.
The red circles are the grid cells where breeding activity for Southern Whiteface have been reported.
The size of the circle represents the number of reports.